
New public opinion poll sheds light on the issues and solutions that matter most to Philadelphians
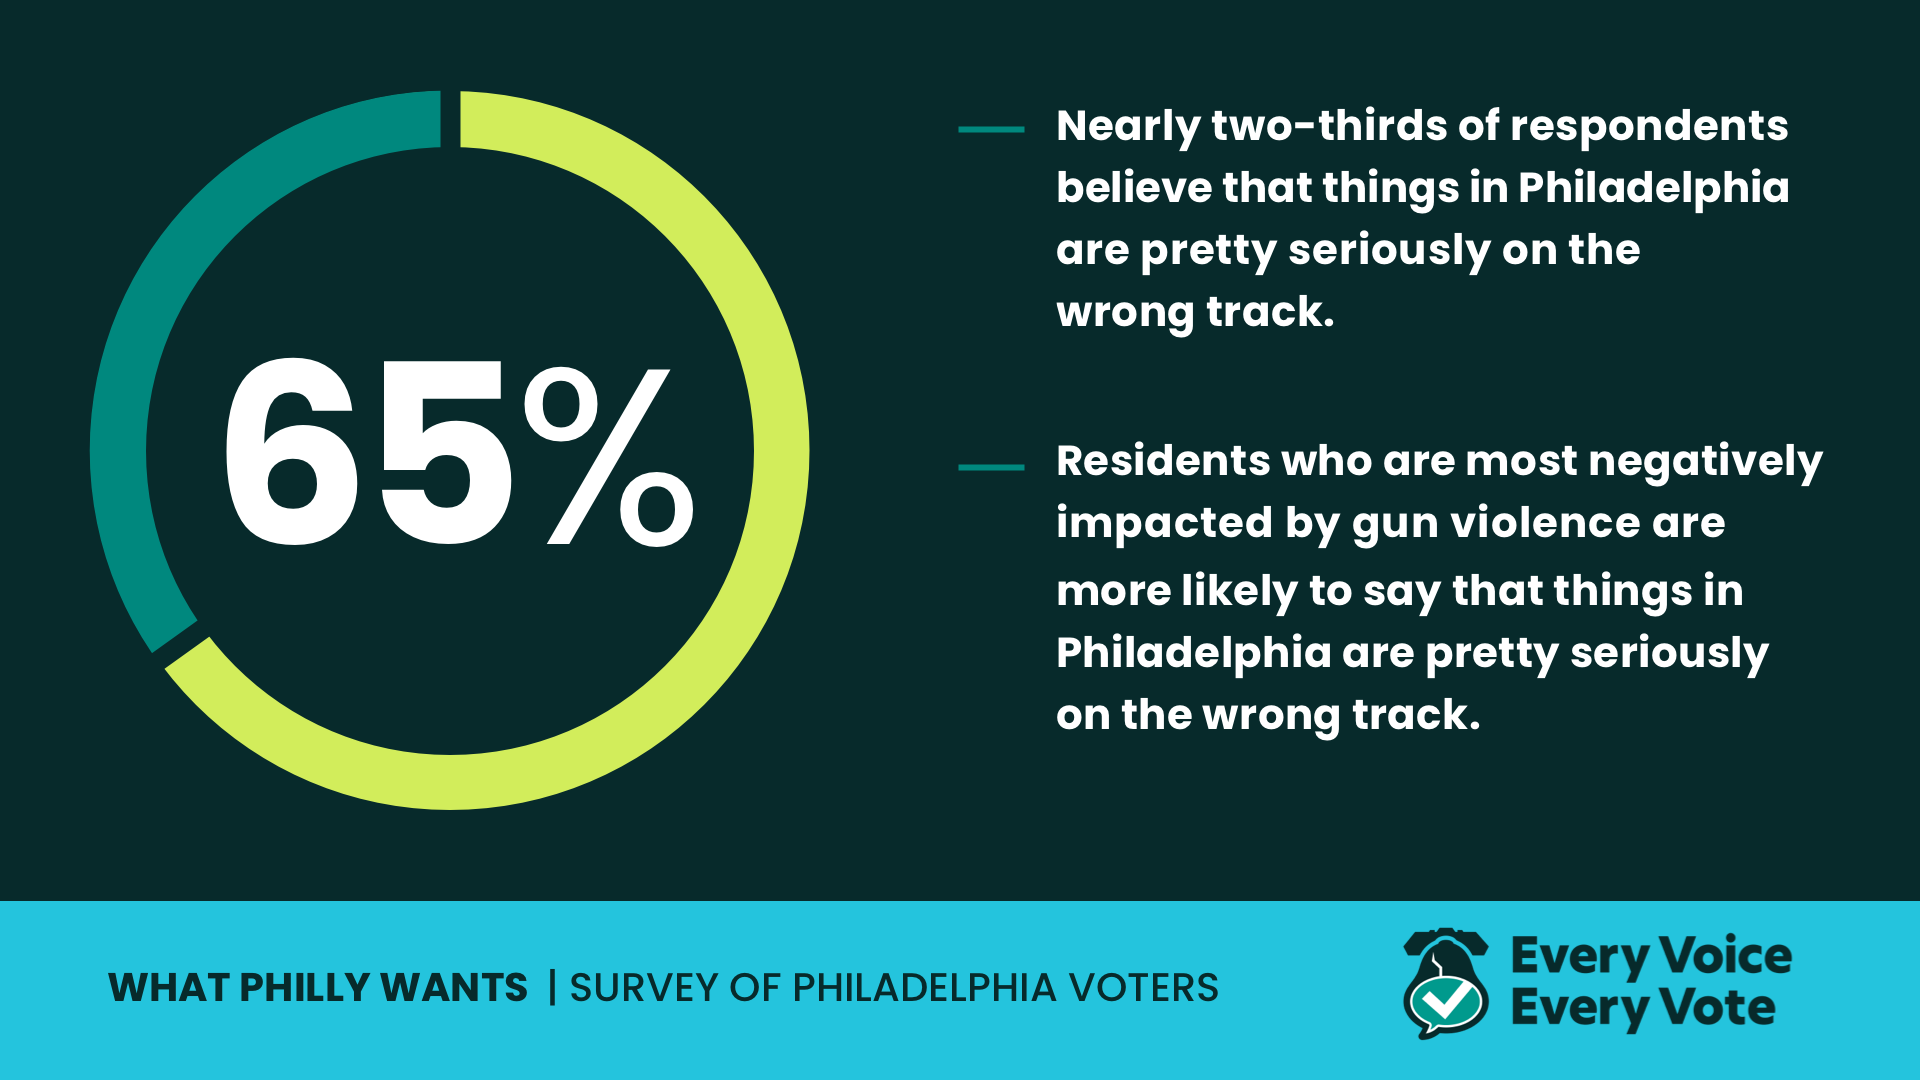
65% of Philadelphians say the city is on the wrong track, according to “What Philly Wants: The Every Voice, Every Vote Survey of Philadelphia Voters”
By Allie Vanyur
Graphic: Anton Klusener/ The Philadelphia Inquirer
Amidst a competitive election season in which the city will elect a new mayor and the entire 17-member City Council, 65% of Philadelphians say that the city is on the wrong track, according to What Philly Wants: The Every Voice, Every Vote Survey of Philadelphia Voters, a new comprehensive public opinion poll that provides insights into the most pressing issues facing Philadelphia.
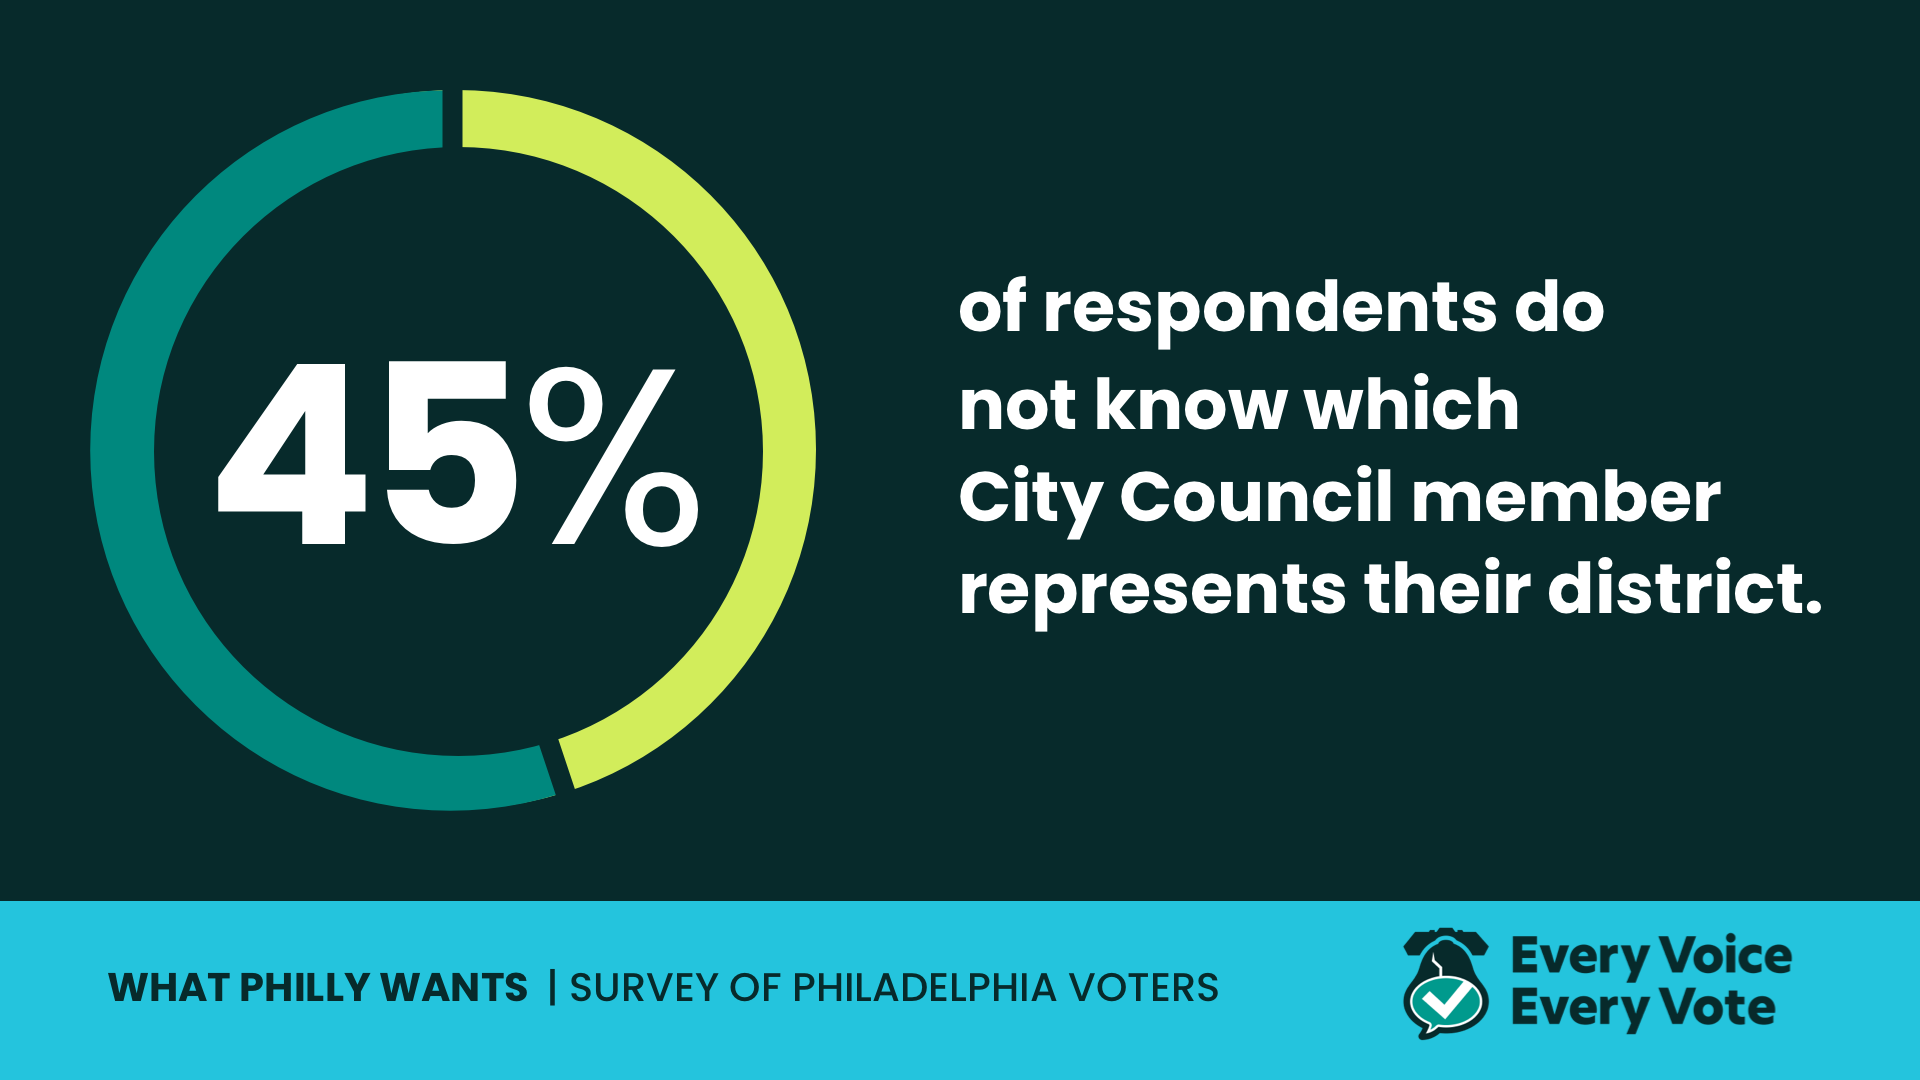
Crime and public safety were identified by residents as the top priority to be addressed by the next administration. And while 85% are absolutely certain that they are registered to vote at their current address, about half (45%) of respondents do not know which City Council member represents their district.
Commissioned by The Lenfest Institute for Journalism, the study is a key component of Every Voice, Every Vote – a citywide initiative that brings together community groups and media organizations to elevate Philadelphia’s diverse voices, inform voters, and promote civic action. At the core of the project is a coalition of more than 55 media and community partners that serve every neighborhood in Philadelphia through multilingual, nonpartisan, issues-oriented journalism, community listening activities, public voter engagement events, candidate forums, voter guides, and more. The poll will help the Every Voice, Every Vote partners better understand how to engage Philadelphia’s diverse communities in the electoral process.
The Lenfest Institute engaged market research firm SSRS to conduct The Every Voice, Every Vote Survey of Philadelphia Voters. The Pew Charitable Trusts advised on survey development and will publish an analysis of the results in April.
By using a traditional public opinion polling research tool and incorporating it into a collaborative, community-centered initiative, the findings shed light on the first-person perspectives of Philadelphians’ rather than specific candidates or platforms. This approach prevents duplication in the field and democratizes access to high-quality data among media outlets and community organizations. The community and media partners of Every Voice, Every Vote will be able to unpack the survey results to better understand the distinct experiences and priorities of people from different neighborhoods, economic statuses, and identities. This will inform community forums, solutions-oriented reporting, and candidate accountability throughout this election cycle and beyond.
The Philadelphia Inquirer published a detailed analysis of the poll, which featured added insight into the issues that matter most to Philadelphians, and interviewed residents about the results. WHYY and The Philadelphia Tribune also published their own analyses of the survey results.
Here are high-level initial findings from the survey responses arranged in three areas: sentiment about the quality of life in Philadelphia, priority issues facing residents and potential solutions, and civic engagement.
Quality of Life
Nearly two-thirds of respondents (65%) believe that things in Philadelphia are “pretty seriously” off on the wrong track. Residents who are most negatively impacted by gun violence are more likely to say that things in Philadelphia are “pretty seriously” off on the wrong track (74% vs. 57% who say minor impact/no impact).
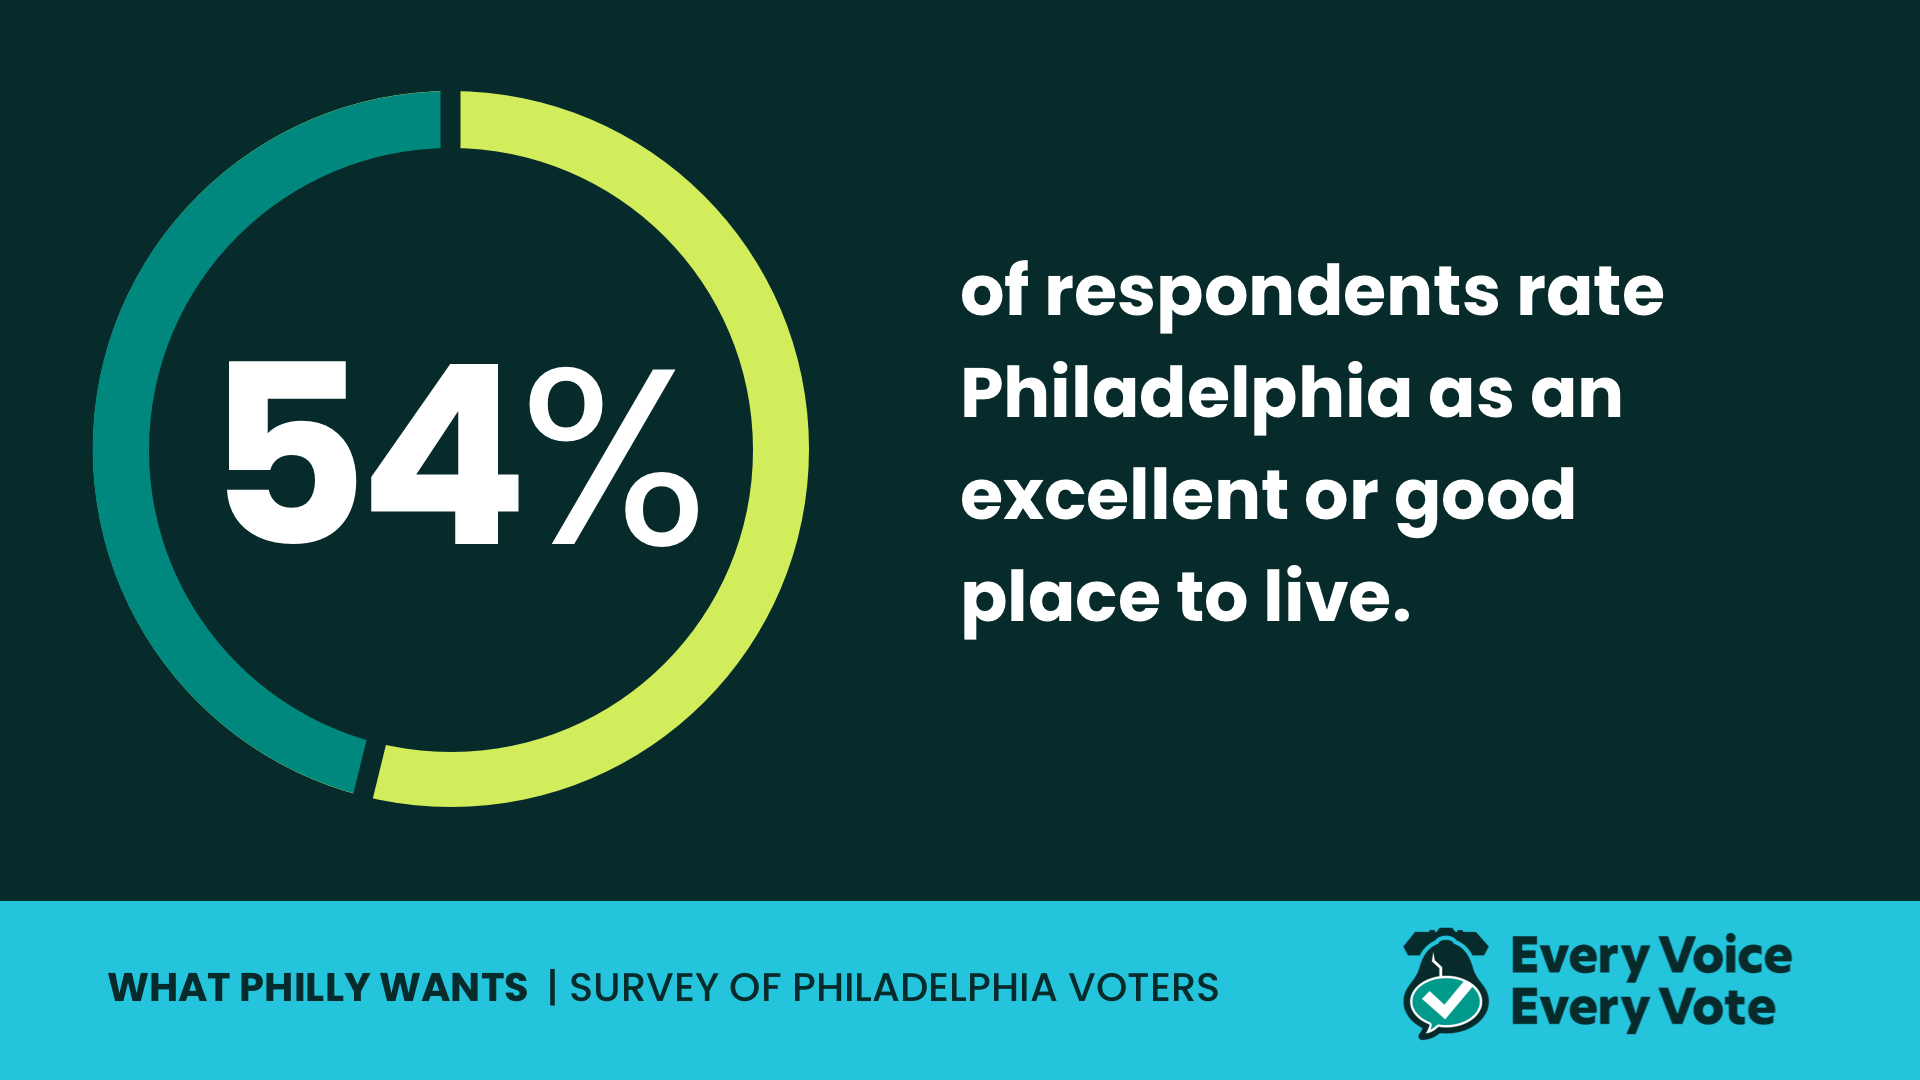
About half (54%) rate Philadelphia as an excellent or good place to live.
-
White respondents are significantly more likely than Black respondents to rate Philadelphia as an excellent or good place to live (63% vs. 47%)
-
About two thirds (65%) of respondents from South and Center Philadelphia rate Philadelphia as an excellent or good place to live, significantly more than respondents from lower Northeast Philadelphia and upper Northeast Philadelphia (46% and 52%, respectively).
About two thirds (64)% of residents say that they have heard gun shots in their neighborhood in the last 12 months. In a separate question about the impact of gun violence, Black respondents were over twice as likely as white respondents to say that gun violence has had a major negative impact on their quality of life (63% vs. 30%).
Issues
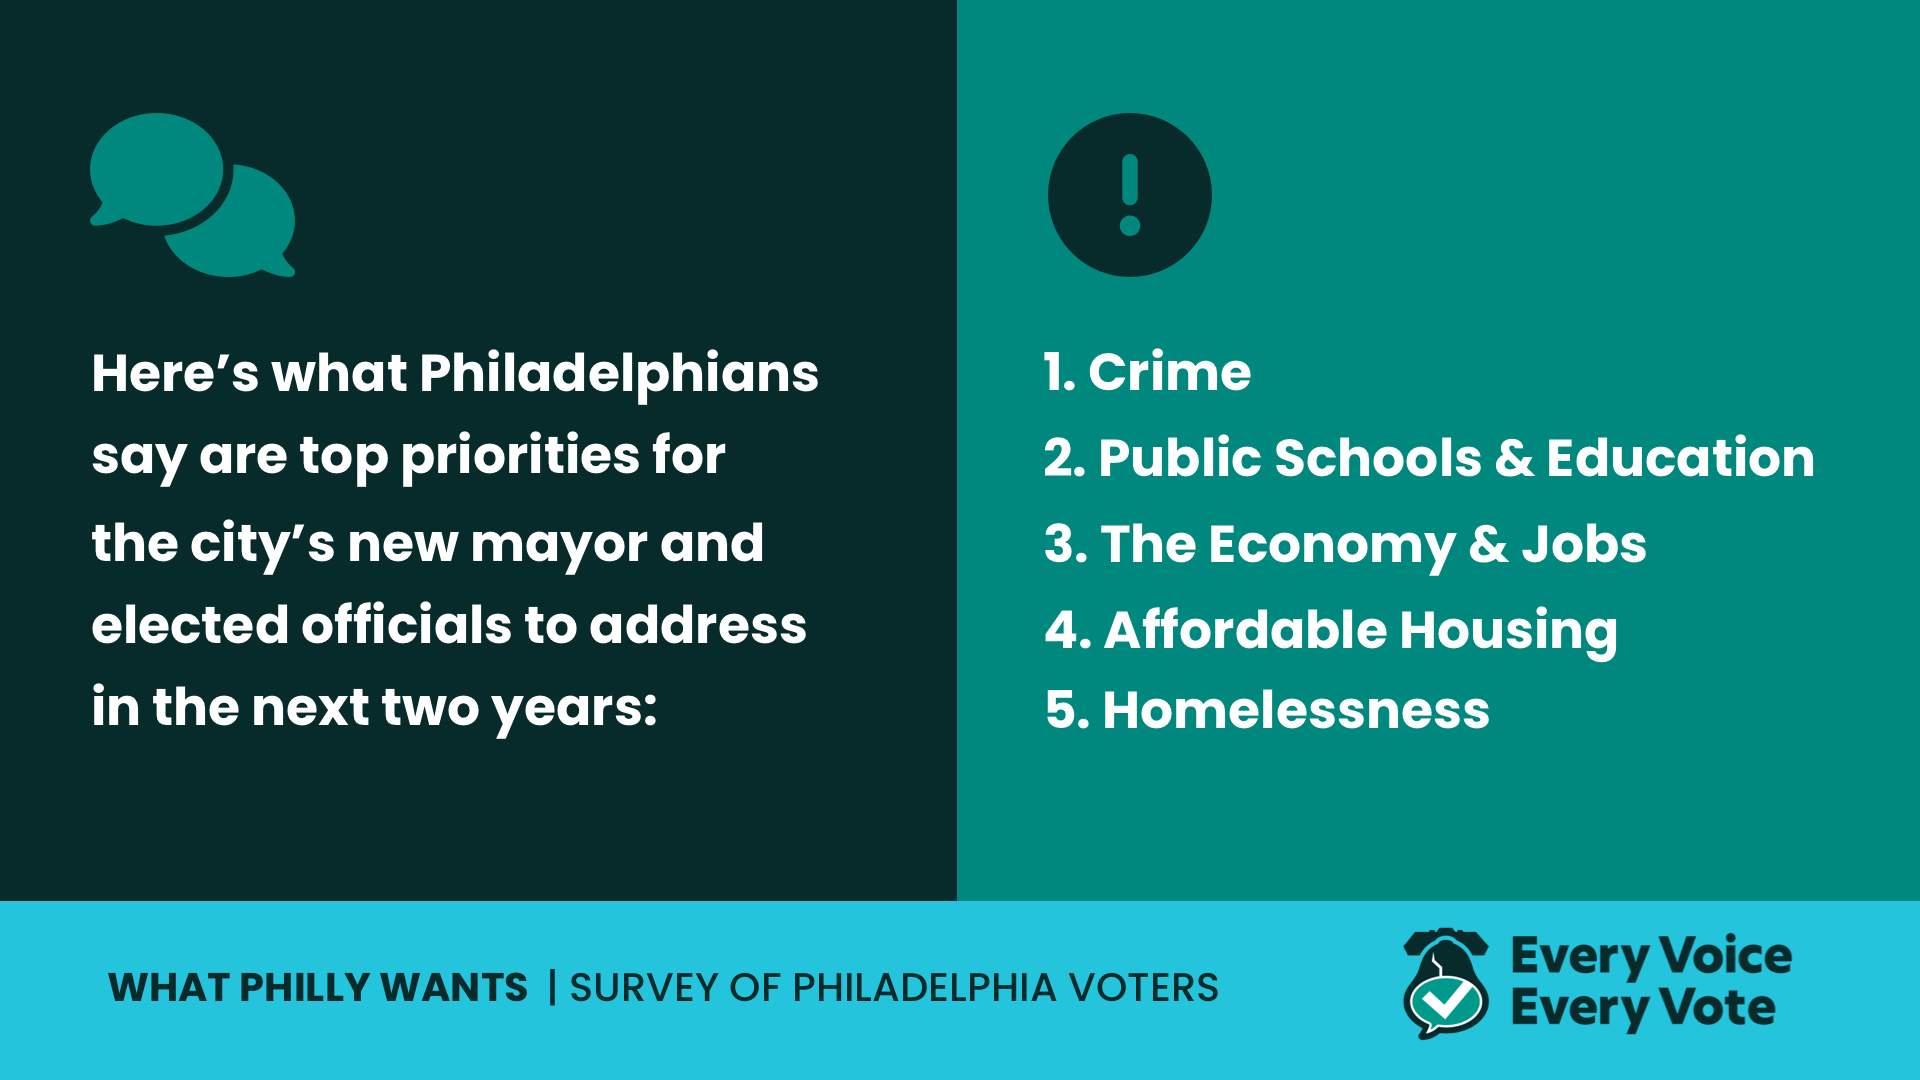
Top priorities for Philadelphia’s mayor and elected officials to address in the next two years (respondents were allowed to make multiple selections):
-
Crime (89%)
-
Public schools / education (75%)
-
The economy and jobs (65%)
-
Affordable housing (57%)
-
Homelessness (59%)
-
Opioid use (55%)
-
City services / infrastructure (51%)
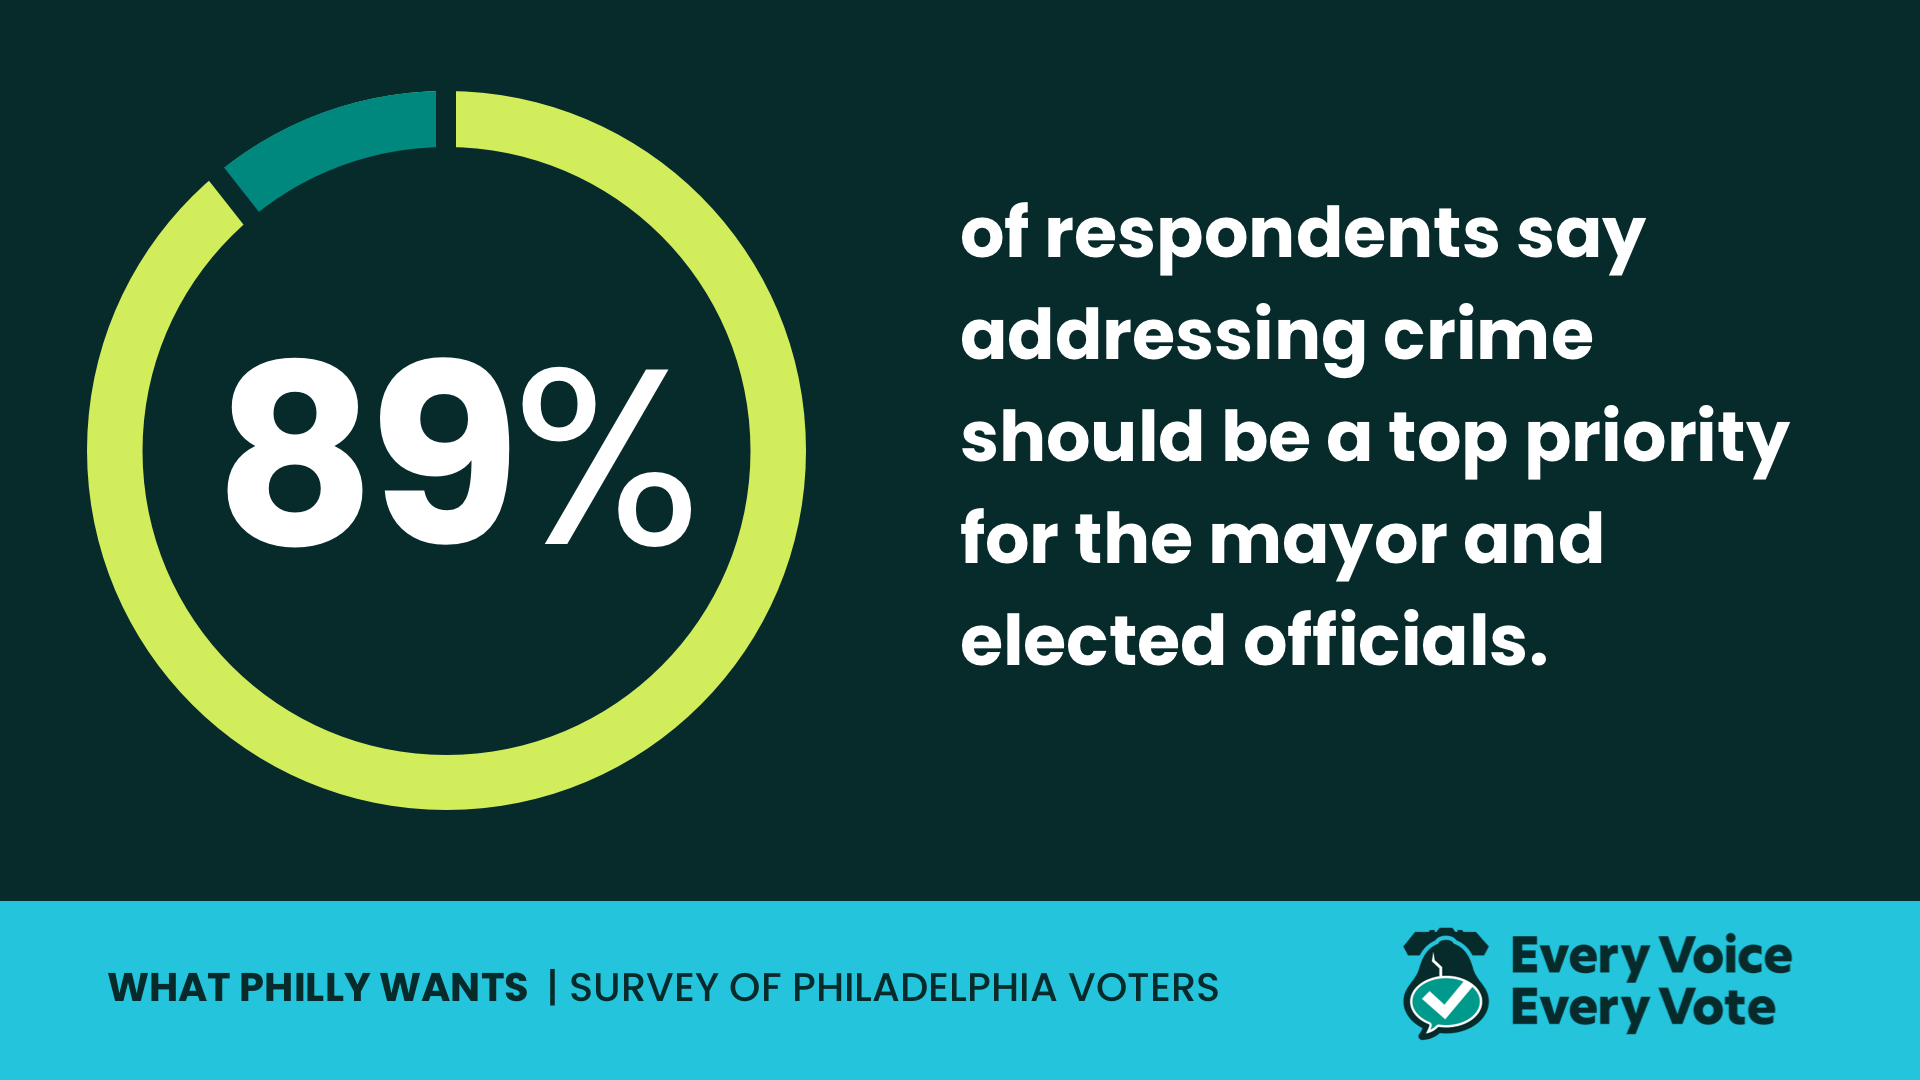
About nine out of ten respondents (89%) say addressing crime should be a top priority for the mayor and elected officials.
Solutions
When asked about “extremely important” or “very important” measures to decrease crime, 87% of respondents selected increasing access to mental health and drug treatments; 86% selected improving relationships between police and the community; and at the bottom of the list 55% selected increasing funding to the police.
In a separate question, 67% said that Philadelphia doesn’t have enough police, 28% said Philadelphia has the right amount of police, and 5% said Philadelphia has too many police.
Respondents who say gun violence has had a major negative impact on their quality of life in their neighborhood are significantly more likely to say that passing stricter gun laws is an extremely important measure to decreasing crime (76% vs. 53% who say minor impact/no impact).
Three top priorities emerged when asked about solutions to improving public schools in Philadelphia:
-
Providing tools necessary for students such as school supplies, technology, and internet access (75%)
-
Funding improvements to school infrastructure (73%)
-
Providing vocational education and job training (72%)
A lower percentage (66%) ranked increasing teacher salaries as a top priority.
65% of Philadelphia residents ranked the economy and jobs as a key area to address in the near future, but their priorities differ depending on their race, neighborhood, and income.
Black respondents (82%) are significantly more likely than white respondents (48%) to say that the economy and jobs should be a top priority. Residents of Southwest Philadelphia (73%), Lower Northeast Philadelphia (73%), and North Philadelphia (72%) are more likely than respondents from South and Center Philadelphia (53%) to say that addressing the economy and jobs should be a top priority.
Hispanic (67%) and Black, non-Hispanic (63%) Philadelphians were more likely to say reducing the city wage tax should be a top priority than White, non-Hispanic residents (51%). When compared according to income, 68% of Philadelphians making less than $50,000 annually (68%) said reducing the city wage tax should be a top priority; whereas, fewer than half of residents earning more than $50,000 (48%) agreed.
Civic Engagement & Voting
While 85% are absolutely certain that they are registered to vote at their current address, about half (45%) of respondents say they do not know which City Council member represents their district.
Two-thirds (66%) of respondents say they either never hear from their elected officials or only hear from them when they're up for reelection.
Methodology
The research included both a qualitative and quantitative phase. To inform and help shape the quantitative questionnaire, SSRS partnered with Temple University’s Institute for Survey Research to conduct six focus groups engaging 58 voting-age residents representing 26 zip codes across Philadelphia. The formal survey was then sent to 14,424 households across Philadelphia between December 5, 2022 and January 9, 2023. 1,247 Philadelphia residents completed the survey, a response rate of 11.1% which is within an expected range for a study of this kind. Participants could complete the survey via web, phone, or mail, and data was collected in both English and Spanish. A full methodology report is available here.
---
Visit everyvoice-everyvote.org to learn more about Every Voice, Every Vote, read partner-produced journalism, and see upcoming public events.
![]()
Every Voice, Every Vote is a collaborative project managed by The Lenfest Institute for Journalism. Lead support is provided by the William Penn Foundation with additional funding from Comcast NBCUniversal, the Dolfinger-McMahon Foundation, the John S. and James L. Knight Foundation, the Knight Foundation Donor-Advised Fund of the Philadelphia Foundation, the Lenfest Institute, Peter and Judy Leone, Harriet and Larry Weiss, and the Wyncote Foundation, among others.